A JavaScript SEO audit compares three versions of every important page: the raw HTML your server sends, the DOM the browser builds after scripts run, and what Google actually indexed. Anything that exists in one version but not the others is a finding. This walkthrough gives you the exact commands and click paths to run that comparison yourself (curl, Chrome DevTools, Search Console’s URL Inspection tool, and a two-pass crawl), then a table that translates each finding into a fix.
You don’t need paid javascript SEO tools for the diagnosis. A terminal, Chrome, and Search Console access cover every per-page check; only the site-wide crawl in Step 4 needs a licensed crawler.
What a JavaScript SEO Audit Actually Checks
The audit exists because Google doesn’t process a JavaScript page in one step. According to Google Search Central, Google handles JavaScript web apps in three phases: crawling, rendering, and indexing. Between crawling and rendering sits a queue. Google says a page may stay there for a few seconds but can take longer, and rendering runs on an evergreen version of Chromium, so browser compatibility is rarely the problem. The delay and its failure modes are.
How much longer than a few seconds? A Vercel and MERJ study of over 100,000 Googlebot fetches, primarily on nextjs.org, found that 100% of HTML pages did get fully rendered, with a median rendering delay of 10 seconds and the 25th percentile inside 4 seconds. The 99th percentile, though, took around 18 hours, and the study found no correlation between JavaScript complexity and the delay. So the question is never “can Google render my page.” It’s “what does Google see before rendering, what changes after, and what breaks along the way.”
Run this audit when you see the classic trigger symptoms:
- Pages are indexed but rank for almost nothing, as if Google sees a thinner page than users do.
- SERP snippets show empty, wrong, or homepage-default descriptions for inner pages.
- Organic traffic dropped after a migration to React, Vue, or another client-rendered framework.
- New pages take weeks to appear in the index while your plain-HTML pages show up in days.
One scope note: this post is the diagnostic procedure. If you want the conceptual grounding first (how rendering works, which frameworks fail where), start with our JavaScript SEO guide and come back with a suspect list.
Step 1: Measure How Much of Your Page Depends on JavaScript
Start with the five-minute dependency test. Fetch your page the way a crawler does, with no JavaScript execution at all:
curl -A "Mozilla/5.0 (compatible; Googlebot/2.1; +http://www.google.com/bot.html)" \
  -sL https://www.example.com/your-page/ -o raw.html
Open raw.html and look for three things: your body copy (pick a sentence from the middle of the page and search for it), your navigation links, and your meta tags. Quick greps that answer most of it:
grep -o "<title>[^<]*</title>" raw.html
grep -c 'href="' raw.html
grep -o 'name="robots"[^>]*' raw.html
Now do the browser version of the same test. Open the page in Chrome, hit Cmd+Shift+P (Ctrl+Shift+P on Windows), type “Disable JavaScript”, press Enter, and reload. What you see is the page’s server-delivered reality.
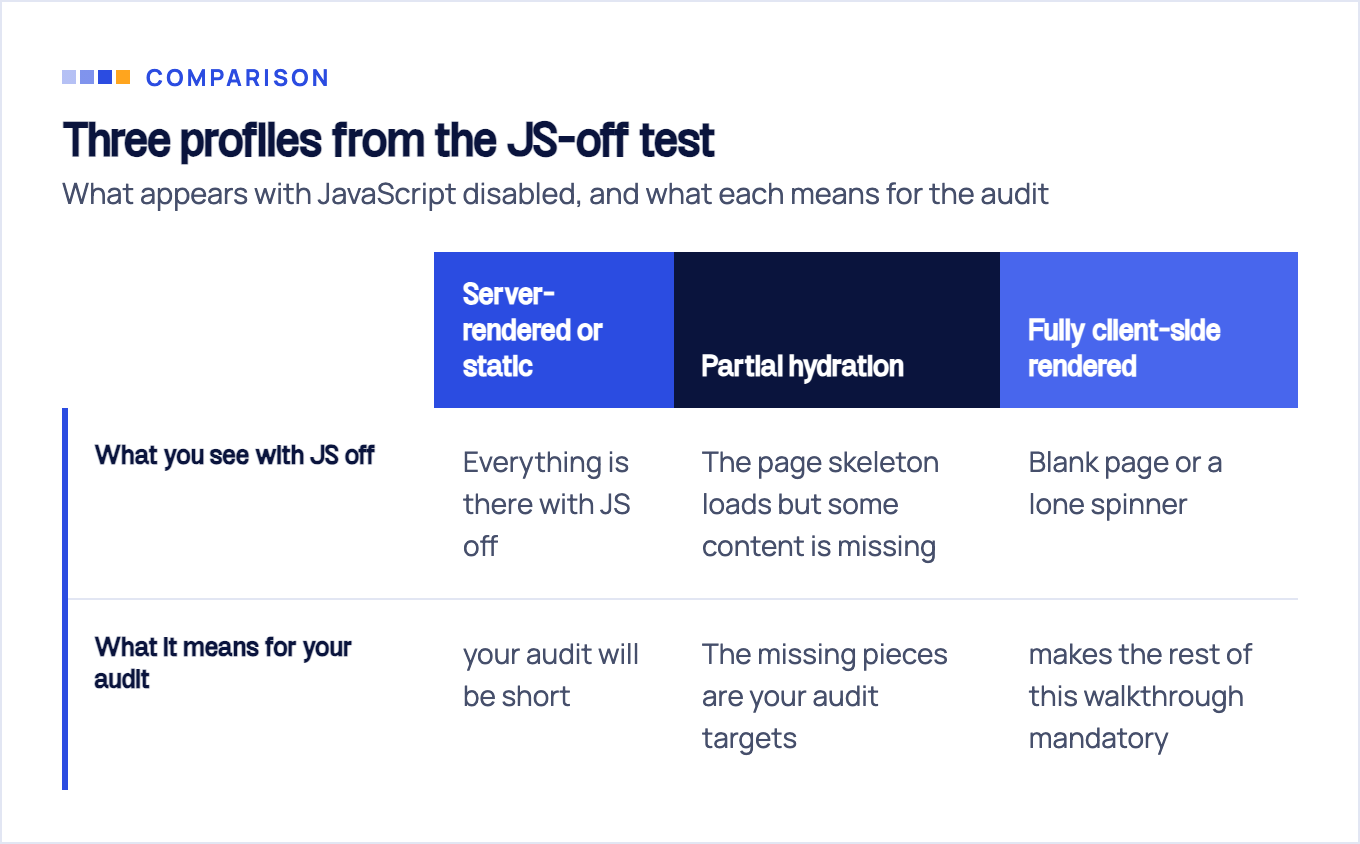
Three profiles emerge:
- Everything is there with JS off. Server-rendered or static. JavaScript is decoration; your audit will be short.
- The page skeleton loads but some content is missing. Partial hydration or client-side data fetching. The missing pieces are your audit targets.
- Blank page or a lone spinner. Fully client-side rendered. This is the highest-risk profile and the one that makes the rest of this walkthrough mandatory.
If you’re auditing a site you didn’t build, the Wappalyzer extension fingerprints the framework in one click, which tells you what rendering options exist before you recommend any fix.
Keep raw.html. You’ll need it again in the AI crawler section, where it stops being an intermediate artifact and becomes a verdict.
Step 2: Diff the Raw HTML Against the Rendered DOM
This is the core technique, and the one most guides gloss over. The raw HTML is what you just curled. The rendered DOM is what you see in Chrome DevTools’ Elements panel after the page loads with JavaScript on. Your job is an element-by-element comparison:
| Element | Where to check | What to compare |
|---|---|---|
<title> | grep vs Elements panel | Same text in both? |
| Meta robots | grep vs Elements panel | Present in raw HTML? Same directives after render? |
| Canonical | grep vs Elements panel | Same URL in both versions? |
| H1 and body copy | text search in both | Does the raw HTML contain the actual content? |
| Internal links | grep -c 'href="' vs link count in DOM | How many links appear only after render? |
| Structured data | search for application/ld+json in both | Injected by JS or served in HTML? |
The View Rendered Source Chrome extension shows raw and rendered side by side with a diff view, which speeds this up considerably. But the manual version keeps you honest: you actually read what changed.
Interpreting the diff is where audits go wrong, so here is the rule that matters:
Typical “changed” findings from real audits: a raw canonical pointing to the homepage that JS rewrites per-route, a noindex in the server response that JS removes after hydration, a title tag that reads “Loading…” until React mounts. Every one of these is a higher-priority fix than any missing content, because each creates ambiguity rather than delay.
Step 3: See What Google Sees With URL Inspection
Steps 1 and 2 compared your server against your browser. Neither tells you what Google’s renderer actually produced. The URL Inspection tool in Search Console does, and it’s the step even deep competitor guides skip.
Per Google’s documentation, a live test in URL Inspection shows a screenshot of the rendered page, the rendered HTML, HTTP headers, JavaScript console output, and the page resources it loaded or failed to load. That’s a complete rendering lab, free, using Google’s actual infrastructure.
The click path:
- Paste the URL into the inspection bar in Search Console, then hit Test live URL. The indexed version is interesting, but the live test shows current rendering behavior.
- Click View tested page and open the HTML tab. Ctrl+F for a sentence that only exists after client-side rendering, the same sentence you searched for in Step 1. Found means Google’s renderer got it. Missing means it didn’t, and nothing downstream will save you.
- Check the Screenshot tab. Blank regions where content should be usually mean a failed data fetch or a script error during render.
- Open More info → JavaScript console messages. Errors here that don’t appear in your own browser often point to code that assumes state Googlebot doesn’t have.
- Still under More info, review Page resources. Any JS or CSS file marked as blocked by robots.txt is a direct rendering handicap.
Two limitations Google itself states: the screenshot is only available in a live test, not for the indexed version, and the live test can’t detect all page conditions or predict indexing success with 100% confidence. Treat a passing live test as necessary, not sufficient.
No Search Console access for the domain? Use the Rich Results Test instead. Google documents it as the route to rendered source for a page on any site, not just a site that you own: click View tested page and the HTML tab shows the rendered HTML. Google lists the same diagnostics for both tools: loaded resources, JavaScript console output and exceptions, and rendered DOM.
One more behavior worth knowing while you’re here: the Search Central basics doc notes that Googlebot caches aggressively and its Web Rendering Service may ignore caching headers. If you shipped a fix but the live test still renders the old bundle, content-hashed filenames for your JS assets are the reliable way to force fresh fetches.
Step 4: Crawl the Site Twice, JS Off, Then JS On
Everything so far was per-page. Step 4 scales it. Crawl the site once with a plain HTML crawler and once with JavaScript rendering, then diff the two crawls. Screaming Frog does both: run it in text-only mode first, switch to JavaScript rendering mode, and crawl again. This is the one step that isn’t free: Screaming Frog keeps JavaScript rendering and the crawl configuration behind a licence, and caps the free tier at 500 URLs per crawl.
Compare three numbers per URL:
- Pages discovered. URLs that only appear in the JS-on crawl are reachable only through rendered links. To Google, they’re late-discovered at best; to non-rendering crawlers, they don’t exist.
- Internal links per page. A page showing 12 links in text mode and 87 after rendering has three quarters of its link graph locked behind script execution.
- Word count per URL. Large deltas mark the pages whose content lives client-side, your Step 2 candidates, found at scale.
This is also where orphaned sections surface: entire route trees that a JavaScript router knows about but no crawlable anchor points to. And while the crawler runs, check robots.txt by hand for one classic own goal: Disallow rules covering /assets/, /static/, or *.js paths. Google’s renderer needs those files; block them and you’ve disabled rendering for your whole site regardless of how clean each page is.
Symptom-to-Diagnosis Table: What Each Finding Means
You now have a pile of observations. This table turns them into diagnoses and fixes.
| Symptom | Diagnosis | Fix |
|---|---|---|
| Raw HTML body is an empty div | Full client-side rendering | Move critical content into the server response: SSR, SSG, or prerendering |
| Canonical or robots differs between raw and rendered | Conflicting signals; Google may honor either version | Make the raw HTML value correct and stop mutating it client-side |
| Links present with JS on, missing with JS off | Router navigation without real <a href> anchors | Use your router’s link component so every link renders a crawlable anchor |
| Error pages return HTTP 200 | SPA soft 404s that can get indexed | Redirect to a URL that serves a real 404, or add a noindex robots meta tag |
| Content depends on cookies or localStorage | Invisible to Google | Serve default content without stored state |
Routes live behind # fragments | Not crawled as separate URLs | Move routing to the History API |
Three of these rows come straight from Google’s own troubleshooting doc and deserve the extra detail.
Soft 404s. Google warns that single-page apps handling errors client-side often return a 200 status code instead of the appropriate error code, which leads to error pages being indexed. The two fixes Google lists are redirecting to a URL where the server responds with a real 404, or adding a noindex robots meta tag to error states. Test it in thirty seconds: request a deliberately fake URL on your domain and read the status code. If your app is a full SPA, this and its sibling problems get a dedicated treatment in our SPA SEO guide.
Storage-dependent content. Google’s renderer does not retain state across page loads: Local Storage, Session Storage, and HTTP cookies are cleared between page loads, and Googlebot declines user permission requests. A page that personalizes or gates content based on stored state shows Google whatever the empty-state fallback is. Make sure that fallback contains your indexable content, not a prompt to enable something.
Fragment routes. Google says not to rely on URL fragments to load different content. The AJAX-crawling scheme that once made #! URLs crawlable has been deprecated since 2015. Anything meaningful behind a # is a page Google will never request. The History API is the routing fix, and it’s usually a one-line router configuration change.
The Check Nobody Runs: Is Your Content Visible to AI Crawlers?
Every step so far audits against Google, the most capable renderer in the business. Here’s the check no competing guide includes: run the same audit against crawlers that never render at all.
Vercel’s AI crawler study found that none of the major AI crawlers currently render JavaScript: not OpenAI’s GPTBot, OAI-SearchBot or ChatGPT-User, not Anthropic’s ClaudeBot, not Meta-ExternalAgent, Bytespider, or PerplexityBot. The OpenAI split matters for this audit: GPTBot crawls for model training, while OAI-SearchBot is what surfaces sites in ChatGPT’s search results. Neither one executes your JavaScript, so your raw HTML decides whether ChatGPT can quote you. They do fetch JS files (ChatGPT in 11.5% of requests, Claude in 23.84%) but never execute them. The only renderers in the AI lane are Gemini, which rides Googlebot’s infrastructure, and AppleBot.
The audit step costs nothing, because you already ran it. The raw.html file from Step 1 is precisely what ChatGPT, Claude, and Perplexity see when they fetch your page. Open it one more time and read it as an LLM would: is the product described? Are the prices there? Is there anything to cite?
We’ve measured the per-bot behavior in detail in our test of which AI crawlers execute JavaScript. And if AI answer visibility is a channel you’re deliberately building, that raw-HTML check is the entry point to generative engine optimization. The same server-rendered content that fixes your Google findings is the prerequisite for showing up in AI answers.
Prioritizing Fixes (and When to Bring In Help)
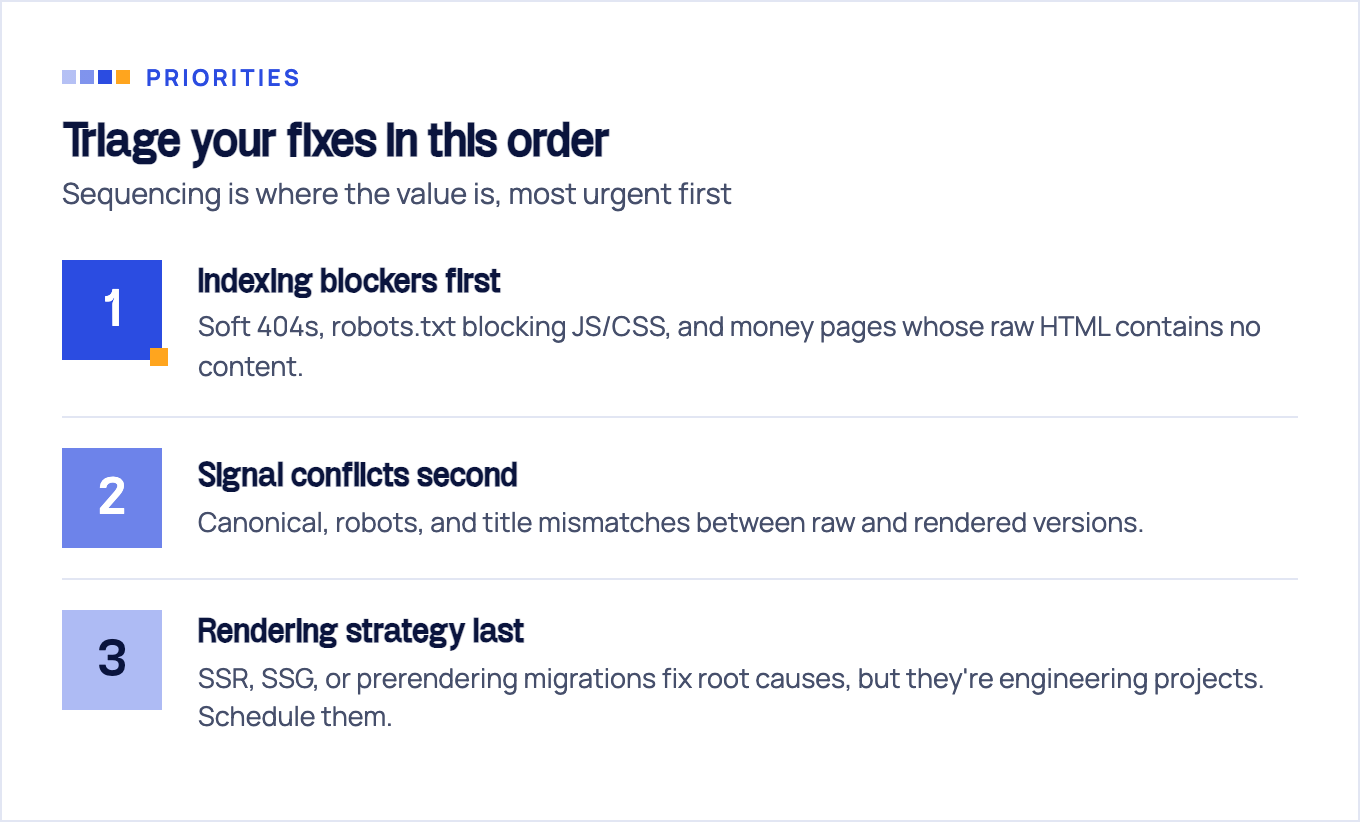
Findings are cheap; sequencing is where the value is. Triage in this order:
- Indexing blockers first. Soft 404s polluting the index, robots.txt blocking JS/CSS, and money pages whose raw HTML contains no content. These aren’t degradations. They’re pages effectively removed from search.
- Signal conflicts second. Canonical, robots, and title mismatches between raw and rendered versions. Each one is Google flipping a coin on your behalf.
- Rendering strategy last. SSR, SSG, or prerendering migrations fix root causes rather than symptoms, but they’re engineering projects. Schedule them; don’t let them block the two categories above, which are often config-level fixes.
Within each tier, sort by page value rather than crawl order. A rendering bug on a page that generates demo requests costs pipeline; the same bug on an old changelog entry costs nothing. Audit your converting pages first and defend them hardest.
The 10-point recap, in the order you’d run it:
- curl the page with a Googlebot user-agent; confirm body copy, links, and meta tags are in the response.
- Reload with JavaScript disabled in DevTools; note exactly what disappears.
- Diff title, canonical, robots, and H1 between raw HTML and rendered DOM.
- Count internal links in both versions.
- Run a URL Inspection live test; search the rendered HTML for a client-side-only sentence.
- Read the JS console messages and blocked resources in the same test.
- Crawl the site twice in Screaming Frog (text mode, then JS rendering) and diff URLs, links, and word counts.
- Check robots.txt for rules blocking scripts or styles.
- Request a fake URL and verify it returns a real 404, not a 200.
- Re-read your Step 1 curl output as the AI-visibility verdict.
Half a day of work for a mid-sized site, and most findings fall into the table above. Where it gets harder is the fix side: choosing between SSR and prerendering for a specific framework, migrating without losing what already ranks, and proving to your team that the rendering bug, not the content, was the ceiling. That diagnostic-to-fix pipeline is exactly what our JavaScript SEO service runs for client sites, converting pages first. Run the audit yourself either way; knowing which of your pages are invisible, and to whom, changes how you spend everything else.
Sources & fact-check
Every factual claim in this article is checked against primary sources, not opinion. Written by Dmitry Shpytaliev, Master SEO tech & content. Last verified July 16, 2026.
- OfficialGoogle Search Central, JavaScript SEO basics (crawl, render and index are separate phases with a render queue)
- OfficialGoogle Search Central, Fix Search-related JavaScript problems (SPA soft 404s return 200 instead of an error)
- OfficialGoogle Search Console Help, URL Inspection tool (live test returns a screenshot, console output and resources)
- Primary dataScreaming Frog SEO Spider FAQ (free tier caps crawls at 500 URLs and cannot render JavaScript)
- Primary dataVercel and MERJ, How Google handles JavaScript throughout the indexing process (10 second median render delay)
- Primary dataVercel, The Rise of the AI Crawler (most AI crawlers fetch JavaScript files but never execute them)
